Introduction Last updated: 2022-03-19

Smart home is the trend in the future. Converting education in such a manner that it incorporates both knowledge and technology will greatly enhance the learning resource. With the potential of IoT for students, there will be more easy and quick learning opportunities. This is the primary reason why IoT learning is recommended. Owing to the reasons for why learning about Smart Homes and IoT is so vital, we have come up with a Smart Home test-bed which is reasonably priced. The product can assist researchers in comprehending their findings and allow businesses to test prototypes on miniature models. To help students to understand the use of IoT in real-life with smart home examples using different combinations is our motivation. Follow us to enjoy the joy of DIY!!

Installation

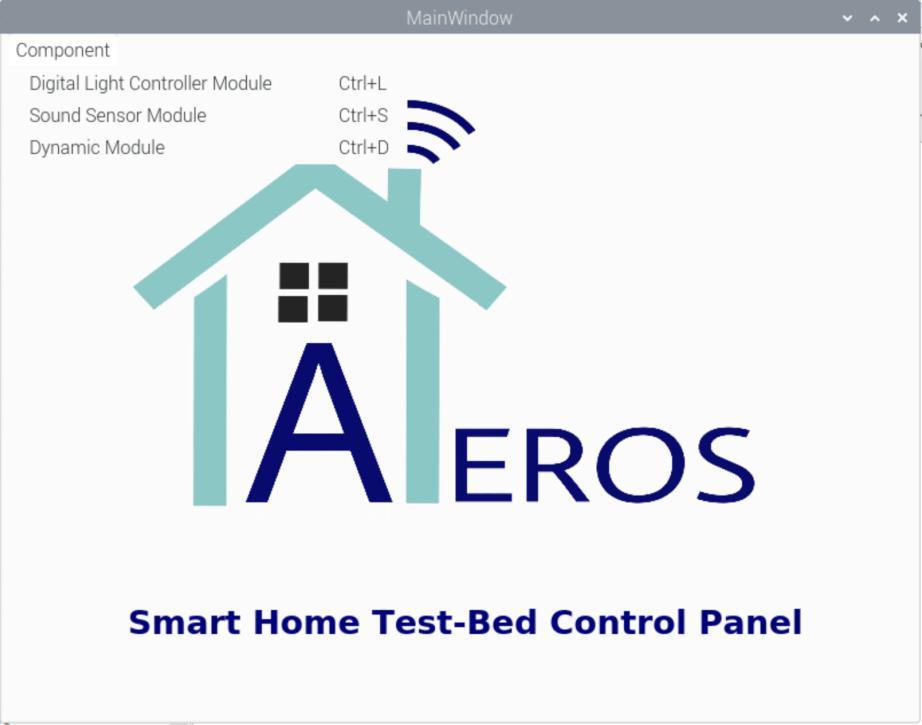
To make it even easier for students and researchers to experiment with IoT, Aeros gives its users an already installed desktop application to work with the components. Please follow the next steps to dive into the world of IoT with Aeros.

Basic Model with 2 components

  1. Sound and Light component, it comes with 2 sensors. The Loudness Sensor plugs into analog port A0 and the Digital Light Sensor plugs into I2C 2 or 3.
  2. To start experimenting further, launch our desktop application and navigate to the specific component, either Light or Sound.
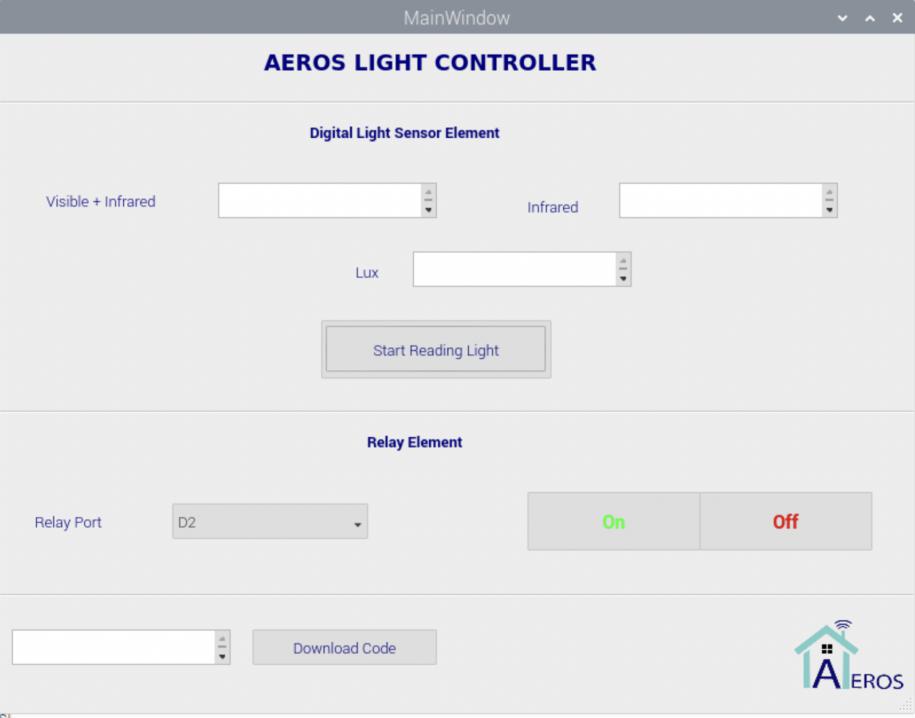
  3. For the Light component, the three values for light: Vis, Lux and Visible IR will be displayed and there is also an On/Off button for Relay.
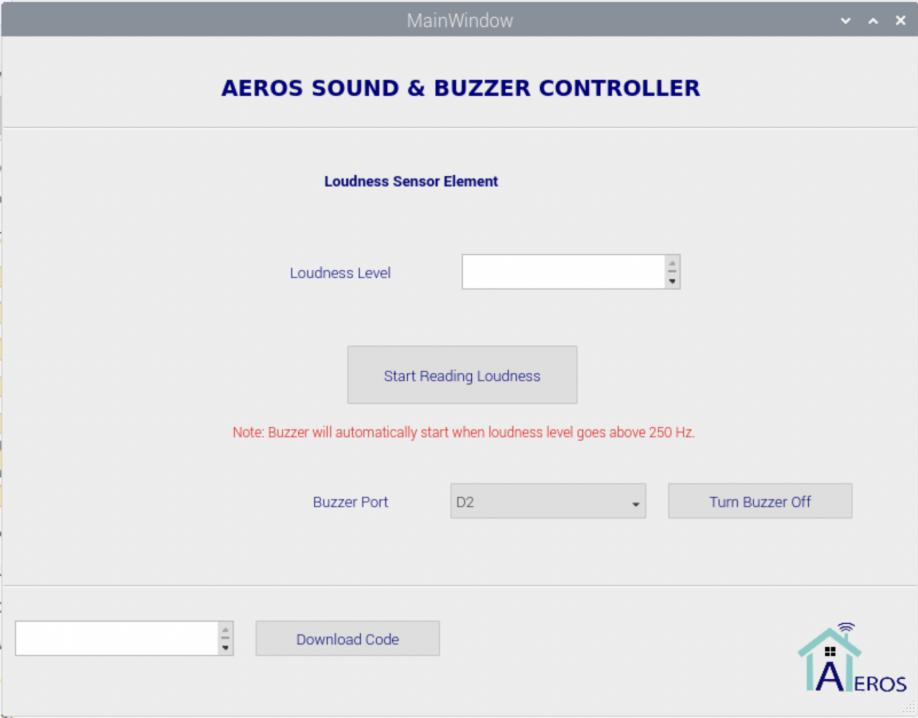
  4. For the Sound component, the Loudness value will be displayed which is being read from the Loudness sensor and the buzzer starts buzzing when the loudness value crosses 250.
  5. Furthermore, to dive deep into the code behind and explore about the components, there is a feature to download the code from our desktop application. For that, one has to give the absolute path where he/she wants the code to be downloaded along with the name of the folder: home/pi/Desktop/[name_of_folder].
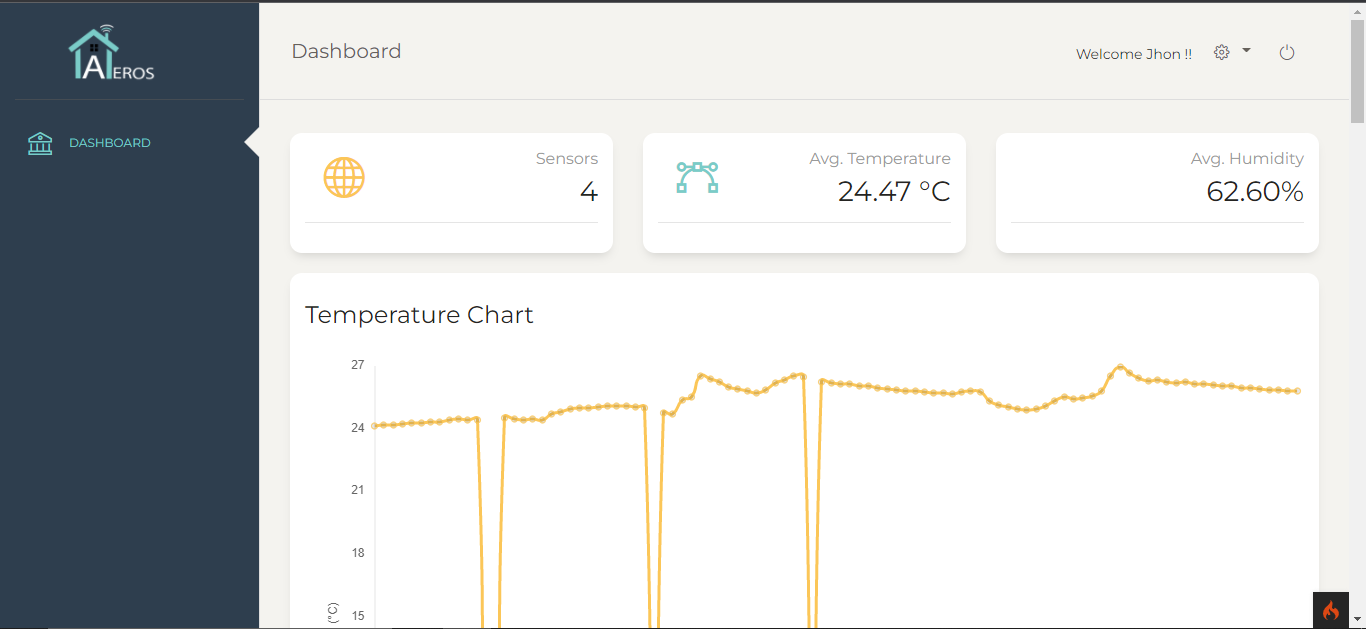
  6. The data being recorded from the sensors can also be viewed on our Dashboard. To visualise and determine the results better, we provide graphs for the same.
  7. The data is recorded locally, only when the user wishes can he/she send it to the server and view it on the dashboard.

Advance Model with 4 components

  1. Sound, Light, Temperature & Humidity and Dynamic component, it comes with 3 sensors. The Loudness Sensor plugs into analog port A0, the Digital Light Sensor plugs into I2C 2 or 3 and the Temperature & Humidity sensor connects to I2C 1.
  2. To start experimenting, launch our desktop application and navigate to the specific component.
  3. For the Light component, the three values for light: Vis, Lux and Visible IR will be displayed and there is also an On/Off button for Relay.
  4. For the Sound component, the Loudness value will be displayed which is being read from the Loudness sensor and the buzzer starts buzzing when the loudness value crosses 250.
  5. For Temperature & Humidity with fan component, the fan will start automatically once the temperature goes above 26 degrees Celsius.
  6. Note

    For buzzer and fan, the values where it goes off (eg: 250 for buzzer and 26 degrees for fan) can be changed from the underlying program.

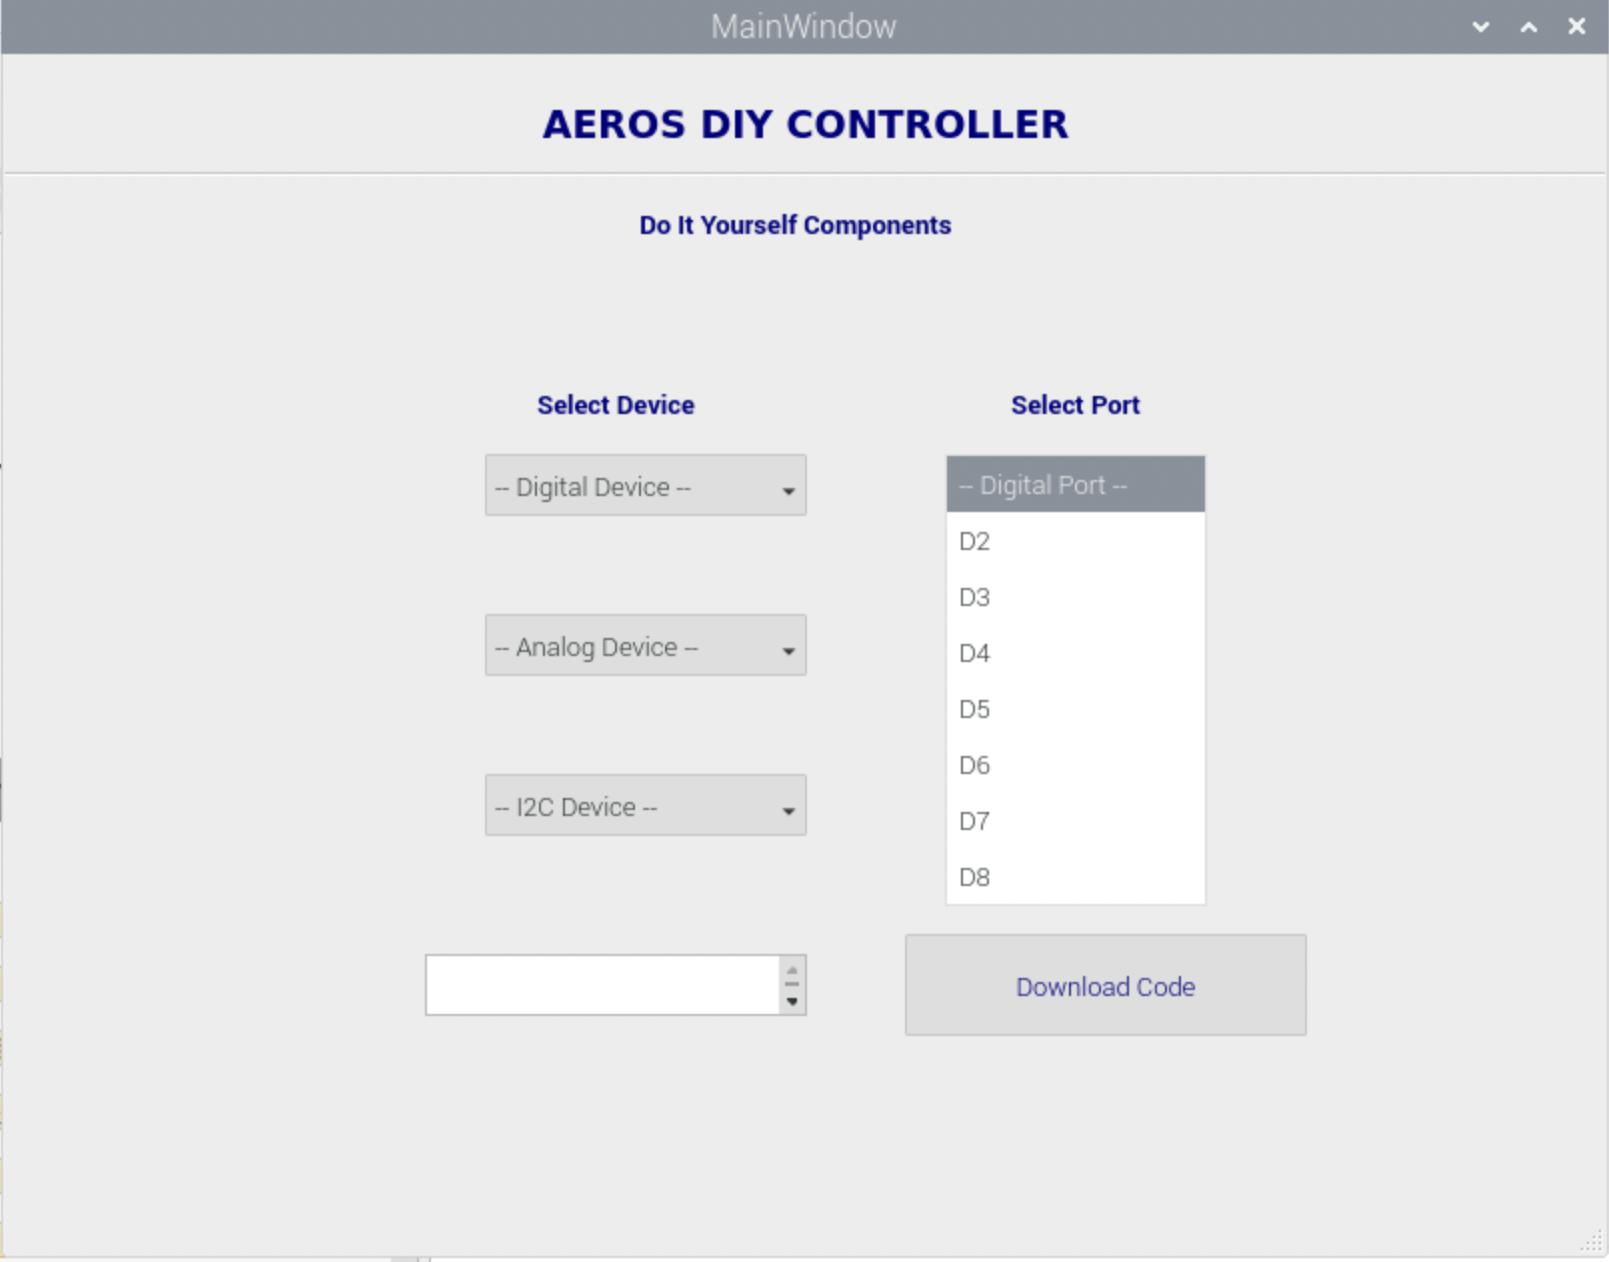
  7. The dynamic component is designed for the user to make use of different combinations of sensors in the same program. The selected sensor's code will be downloaded.
  8. Note

    For now, limited number of sensors are present. It will be continuously developed as per the user's needs and market requirements.

  9. Furthermore, to dive deep into the code behind and explore about the components, there is a feature to download the code from our desktop application. For that, one has to give the absolute path where he/she wants the code to be downloaded along with the name of the folder: home/pi/Desktop/[name_of_folder].
  10. Using dynamic component screen in one can add component of their choice and experiment with it.
  11. The data being recorded from the sensors can also be viewed on our Dashboard. To visualise and determine the results better, we provide graphs for the same.
  12. The data is recorded locally, only when the user wishes can he/she send it to the server and view it on the dashboard.
The data is recorded locally, only when the user wishes can he/she send it to the server and view it on the dashboard.

Happy learning!